Changes in Corneal Topography in Eyes with Keratoconus post Corneal Cross Linking
Dr Prabhat Nangia, Dr Sarang Lambat, Dr Vinay Nangia
559, Suraj Eye Institute, Nagpur.
Case Description
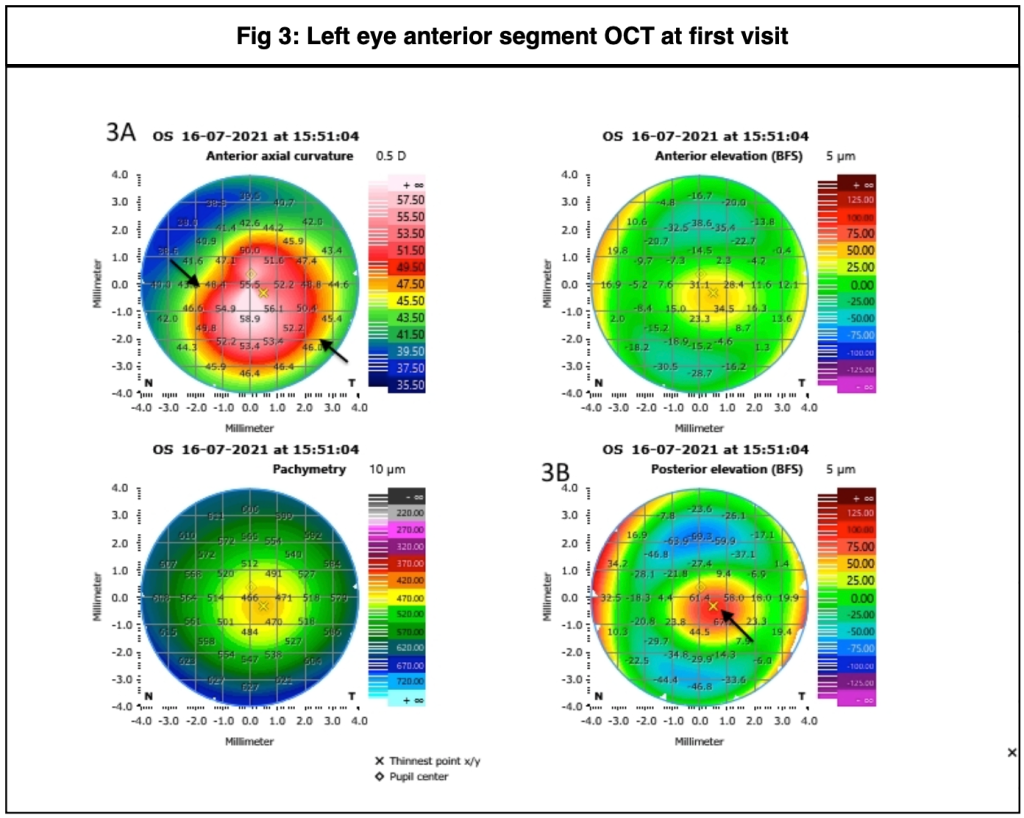
A male, 13 years of age, came for follow up as advised at the last visit. He was a known case of left eye (OS) keratoconus with tomographically normal right eye (OD). On examination, his Best corrected visual acuity (BCVA) was 6/9 in OD and 6/12 in OS. Slit lamp evaluation showed central corneal thinning with ectasia, worse in the left eye than right eye. Anterior segment optical coherence tomography (ASOCT) showed frank keratoconus in OD (Fig. 1) with definite progression from previous visit (Fig. 2) and frank keratoconus in OS worse than OD (Fig. 3), which also showed progression from the previous visit (Fig. 4). Since both eyes showed progressive ectatic disease on ASOCT, he was advised corneal cross linking (CXL) in OS followed by OD.
One month post OS CXL, BCVA was 6/12P. He was subsequently lost to follow up for 11 months, and then returned for OD CXL. BCVA was 6/9 in OD and 6/12P in OS. Repeat ASOCT showed further progression in OD (Fig. 5) and stabilisation of the disease in OS (Fig. 6) one year post OS CXL. He underwent OD CXL. One month post the procedure, ASOCT was repeated, which showed further steepening of topography in OD (Fig. 7), while flattening effect was noted in OS, 13 months after OS CXL (Fig. 8).


Fig. 2: This image shows the previous topography (2A), the current topography (2B) and the difference map (2C) , which shows definite steepening in the right eye. The Kmax increased by 1.5 D, and the SimK average increased by 0.88 D during this period (graph, 2D).


Discussion
Corneal cross- linking was introduced by Wollensak et al(1) as a procedure to stop the progression of keratoconus. Over the past two decades, this procedure has become the cornerstone of the management of eyes with progressive ectatic disease, delaying or avoiding altogether the need for corneal grafts in many cases. The procedure involves changes in the cornea at a molecular level, by increasing the number of chemical bonds between the collagen fibrils. While the changes that occur in the topography of the cornea after the procedure have been studied, they may at times be difficult to predict, particularly in the early post operative period.
In a study by Padmanabhan et al(2) of long term follow up in paediatric keratoconus eyes that underwent CXL, an initial increase of Kmax has been noted at the 3 month follow up. This was followed by a flattening effect within the next three months, that lasted for the next few years. Vinciguerra et al(3) also reported an increase in K1, K2 and minimum K at one and three months post op, with the six month K values nearly the same as the pre op values. At two years, K2 and minimum K were significantly lower than pre op values. These findings suggest an initial steepening effect post CXL, as was seen in the right eye of our patient at the last follow up. In the left eye, while we do not have early post operative scans, the stabilisation of the disease noted at one year follow up, followed by the flattening at 13 months, suggest a postoperative course similar to that noted in literature. Based on the course of the left eye, we may expect that the right eye may also show signs of flattening beyond the six month to one year period post CXL.
Overall, the first six months post CXL may not be ideal to evaluate the effect of the procedure, and as such, it would be advisable to keep the patient under 3 to 6 monthly follow ups to study the outcome of treatment.
ReadWise
1. Wollensak G, Spoerl E, Seiler T. Riboflavin/ultraviolet-A- induced collagen crosslinking for the treatment of keratoconus. Am J Ophthalmol 2003;135(5):620-627 https://doi.org/10.1016/S0002-9394(02)02220-1
2. Padmanabhan P, Rachapalle Reddi S, Rajagopal R, et al. Corneal Collagen Cross-Linking for Keratoconus in Paediatric Patients- Long Term Results. Cornea 2017 Feb;36(2):138-143 DOI: 10.1097/ICO.0000000000001102
3. Vinciguerra P, Albé E, Frueh BE, et al. Two-year corneal cross-linking results in patients younger than 18 years with documented progressive keratoconus. Am J Ophthalmol. 2012;154:520–526 DOI: 10.1016/j.ajo.2012.03.020
Correspondence
Dr Prabhat Nangia
DNB, FICO, FMRF, FAICO
Consultant
Department of Cornea and Ocular Surface
Suraj eye Institute
Email – education@surajeye.org