Diabetic Retinopathy – Clinical and Imaging Correlation
Dr. Sarang Lambat, Dr. Vinay Nangia
Suraj Eye Institute, 559 New colony, Nagpur, India
Case Description
A male, 54 years of age, came with floaters in the left eye since 2 days. He was a known diabetic under treatment since 10 years. On examination his BCVA was 6/6p in OD and 6/9p in OS. IOP with applanation tonometry was 16 mmHg in OU. Fundus examination revealed features of proliferative diabetic retinopathy with maculopathy in OU. A fluorescein angiography and SDOCT was done to assess and document the retinopathy.

Figure 1b: Fundus photograph of the left eye shows presence of multiple dot and blot hemorrhages (yellow arrow), micro aneurysms (green arrow), looping of vein (blue arrow), circinate retinopathy (red arrow), pre retinal blood (black arrow) and vitreous hemorrhage (white arrow).

Figure 2b: Fundus fluorescein angiography of the left eye shows presence of leaking microaneurysms (green arrow head) and blocked fluorescence due to pre retinal hemorrhage and vitreous hemorrhage (yellow arrow heads). Leaking neovascular tufts are seen (red arrow heads).

Figure 3b: SDOCT, horizontal line scan of the left eye showing a normal fovea with mild distortion of retinal layers and collection of hyper reflective dots within suggestive of resolving hard exudates.
On the basis of this patient was diagnosed to have both eyes proliferative diabetic retinopathy with right eye non centre involving macular edema. He underwent both eyes injection antiVEGF followed by pan retinal photocoagulation and modified grid macular laser for the right eye.
Patient missed the follow ups and reviewed with us after 2 years with blurring of vision in both eyes. On examination his BCVA was 6/36 in both eyes. Anterior segment was WNL. IOP was normal.
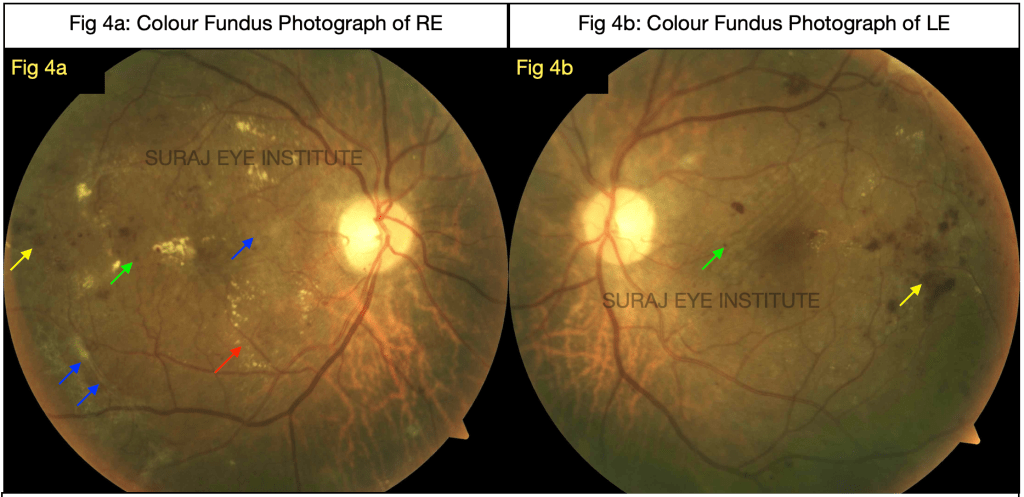
Figure 4b: Fundus photograph of the left eye shows presence of multiple dot and blot hemorrhages (yellow arrow), micro aneurysms (green arrow) and Internal limiting membrane folds (white arrow).

Figure 5b: SDOCT, horizontal line scan of the left eye showing evidence of diffuse retinal thickening (1), cystoid macular edema (2), neurosensory detachment (3), epiretinal membrane (4) and hyper-reflective foci (5).
On the basis of this a plan of right eye injection antiVEGF followed by vitrectomy and left eye injection antiVEGF followed by macular laser
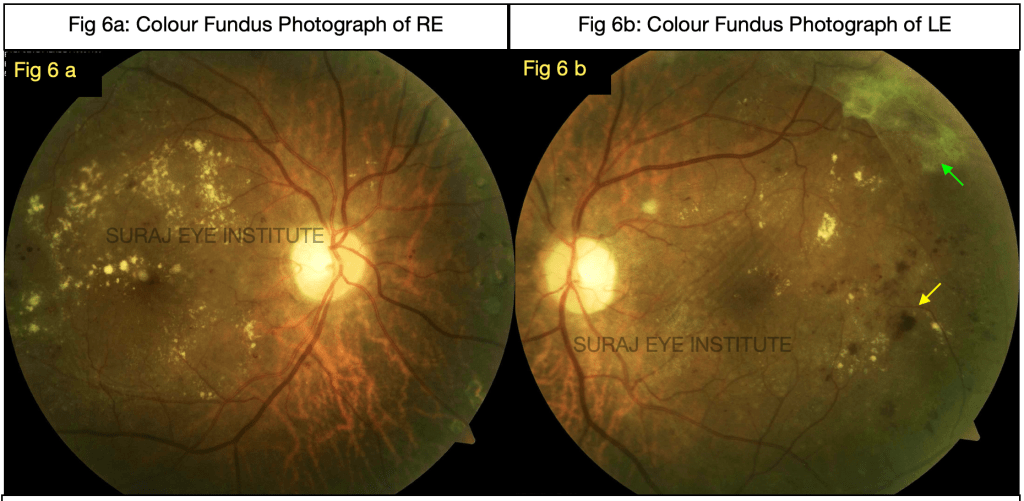
Figure 6b: Fundus photograph of the left eye shows presence of multiple dot and blot hemorrhages (yellow arrow) epiretinal membrane with fibrovascular proliferations along superotemporal arcade (green arrow)

Figure 7b: SDOCT, horizontal line scan of the left eye post injection showing evidence of diffuse retinal thickening (green arrow), cystoid macular edema (yellow arrow), epiretinal membrane (red arrow) and hyper-reflective foci (blue arrow)
Discussion
After undergoing intervention at initial presentation, patient responded well but didn’t follow up for routine examination. At subsequent follow up he had significant macular edema in the right eye along with epiretinal membrane and vitreomacular traction and hence a surgical intervention was done. Post surgery he did well and the macular architecture was much better. Left eye had more of cystoid with diffuse retinal thickening and hence he underwent antiVEGF injection which helped in resolution of macular edema. SDOCT has been imperative in categorising various morphological types of diabetic macular edema. This helps us in planning a tailored approach for each patient for efficient management of such cases.
Readwise
- Acón D, Wu L. Multimodal Imaging in Diabetic Macular Edema. Asia Pac J Ophthalmol (Phila). 2018 Jan-Feb;7(1):22-27. doi: 10.22608/APO.2017504. Epub 2017 Jan 29. PMID: 29376234.
- Mehta N, Tsui E, Lee GD, Dedania V, Modi Y. Imaging Biomarkers in Diabetic Retinopathy and Diabetic Macular Edema. Int Ophthalmol Clin. 2019 Winter;59(1):241-262. doi: 10.1097/IIO.0000000000000249. PMID: 30585929.
Correspondence
Dr. Sarang Lambat
MS, FRF
Consultant
Vitreoretinal services
Suraj Eye Institute
Nagpur
Email –education@surajeye.org